Bratton Clovelly Population
Using a combination of information from the Histpop website, along with Andrew Hinde’s excellent work England’s Population: A History Since the Domesday Survey and actual statistics from the parish registers 1555 to the 20th century, the history of Bratton Clovelly’s population is starting to emerge. Until we’ve pursued family reconstitution, important parts of the story will still be missing but a lot can be said already.
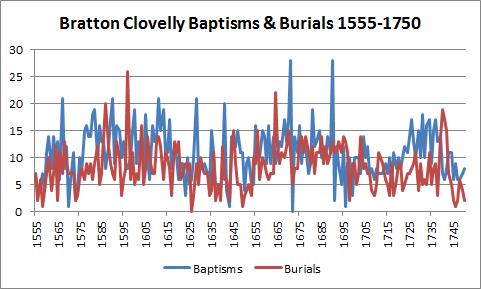
Bratton Clovelly probably had a population of around 200 people at the time of Domesday and may have already reached a population of over 400 people by the latter 16th century. It may have even been near what appears to be this ‘natural’ figure in the early 1300s before perhaps more than half of the people in Devon were lost in the plague of 1348-50. Based on baptisms and burials, it was a remarkably stable place then through the mid-1700s and suffered little from the peaks of pestilence and famine (except for the widespread famine in 1597-98 due to repeated harvest failures).
In fact, this parish was in the healthiest part of England and Wales based on age at death and infant mortality statistics from Andrew Hinde’s work.
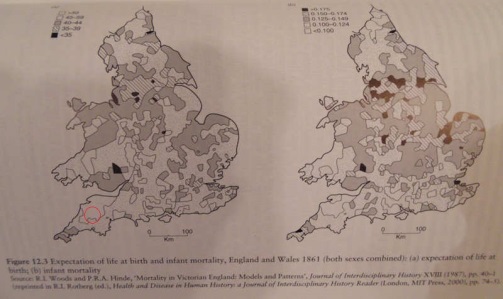
Health of England & Wales in 1861, from A Hinde’s England’s Population
However, the Histpop figures tell a story of dramatic change after centuries of stability. Bratton Clovelly saw a rapid increase in population from at least 1801 through 1841 followed by just as dramatic a decrease from 1851 to 1911.
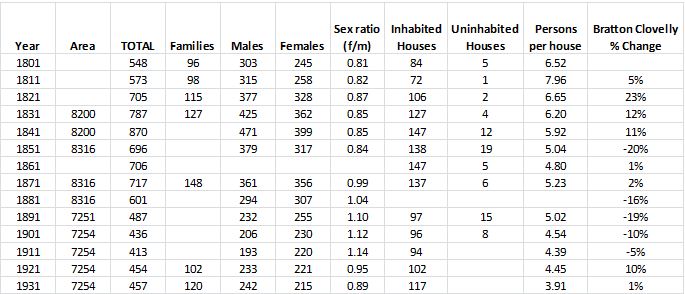
Bratton Clovelly Population Statistics 1801-1931, from Histpop.org
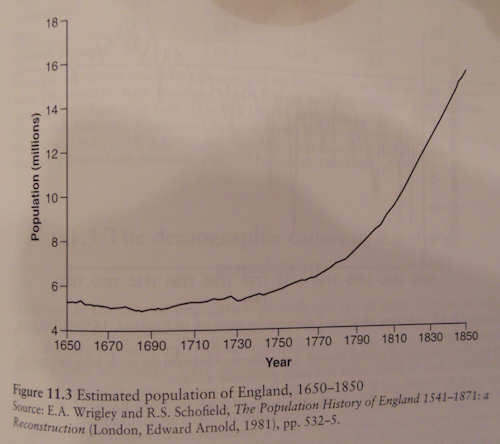
Estimated Population of England 1650-1850,
from A Hinde’s England’s Population
So what happened? Looking first at the period 1801-1841, Bratton Clovelly joined the rest of England in a huge growth spurt. England itself doubled in size and while Bratton Clovelly and other surrounding towns didn’t keep pace with the booming industrial centres, it did grow by almost 60% from 1801 to 1841.
Although local conditions varied, Andrew Hinde evidences that England’s overall increase in this timeframe can be mostly attributed to an increased fertility rate. This was driven by two factors, a gradual lowering of the age at first marriage and a higher percentage of the population choosing to marry. There was some decrease in mortality but it was the fertility factors that really drove the curve.
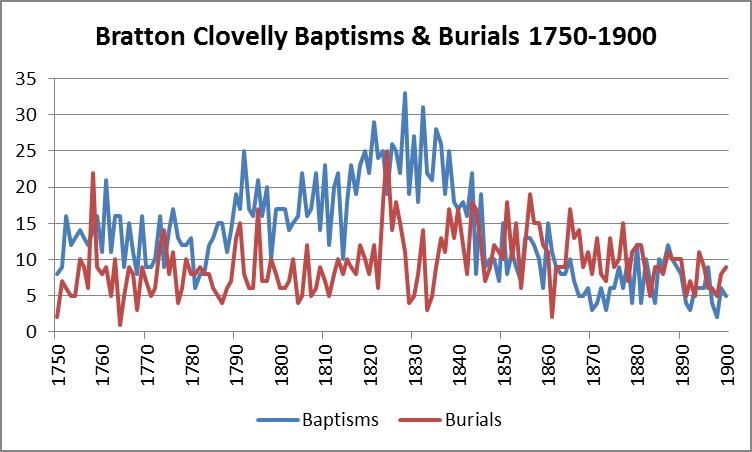
Bratton Clovelly’s baptisms and burials in this timeframe highlight this change in fertility. It should be noted that these statistics are from the parish registers and, from at least the 1830s, the non-conformist population was rising in the parish. In the 1851 religious census, over 40% of those attending services on the day of the census were Bible Christian and a small group of Baptists. Therefore, baptism and burial comparisons in this timeframe should be viewed relative to each other rather than as an absolute representation of the parish. There is no evidence to indicate that the relative picture would look any different for the non-conformists though.
Family reconstitution will hopefully add to an understanding of this timeframe in future, with more local information on all three of the components of population change: fertility, mortality and migration. But so far, the story seems fairly standard. Housing stock kept pace with only a brief period of increased household size. The female to male ratio remained stable, although I don’t yet have an explanation for the discrepancy between the number of males and females in the parish. Perhaps the number of males was increased by young unmarried men locating to the parish for farm work.
But after 1841, the story is anything but standard. While England went on to double yet again in size from 1851 to 1901, a massive correction took place in Bratton Clovelly with the population dropping 20% between 1841 and 1851. After a brief stabilisation in the 1860s and 1870s, it then continued to decline until 1911. Histpop explains the change from 1841 to 1851 in Bratton Clovelly as being due to emigration. See our Migration study for further analysis of the period 1841-1861.
The following population statistics are from the Histpop website for the period 1801 to 1931. In 1885, the western detached part of Bratton Clovelly known as Godescote was re-districted to the Broadwoodwidger parish. Godescote consisted of 63 people in the 1891 census. The 1951 and 1961 statistics are from the Vision of Britain website and do not include Godescote which had 57 inhabitants in 1939. The current population figure is from Wikipedia.
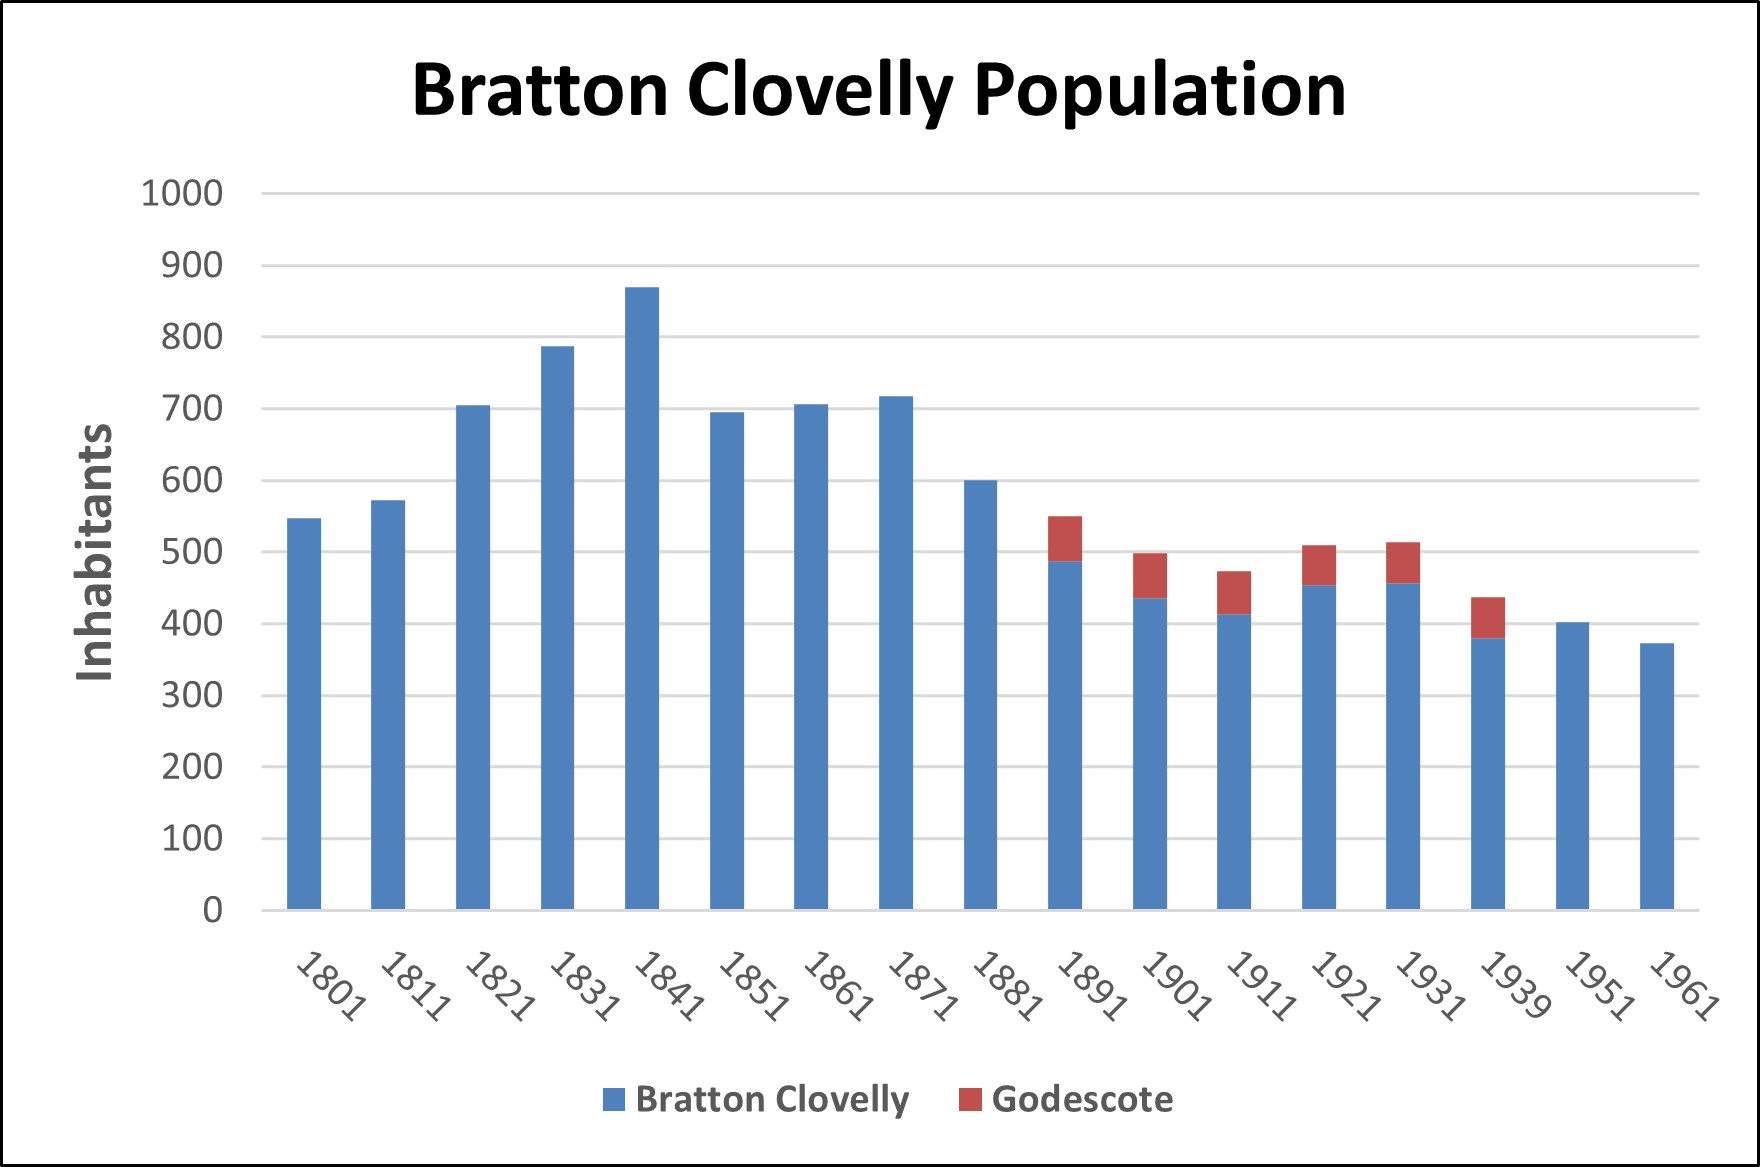
By about the mid-1900s, Bratton Clovelly’s population stablised at around 400 people, back to the ‘natural’ figure of medieval times. It seems that this was a figure that historically the land could reasonably support as an agricultural area and a figure that nowadays has proved attractive to new arrivals to the parish.